简单学习了解一下phlare
认识
Grafana Phlare 是一个用于聚合连续分析数据的开源软件项目。持续分析是一种可观察性信号,可让您了解工作负载资源(CPU、内存等)的使用情况,直至精确到代码行。
Grafana Phlare 与 Grafana 完全集成,允许您与其他可观察性信号相关联,如指标、日志和跟踪。
Grafana phlare的核心功能包括:
- 易于安装:使用其单片模式,你只需要一个二进制文件即可启动并运行Grafana Phlare,无需其他依赖项。在kubernetes上,一个helm chart就可以在不同的模式下进行部署
- 水平可扩展性:你可以在多台机器上运行Grafana Phlare,这使得你可以轻松扩展数据库,以处理你的工作负载生成的分析量
- 高可用性:Grafana Phlare会复制传入的配置文件,确保在机器发生故障时不会丢失数据。这意味着你可以在不中断配置文件摄入和分析的情况下推出
- 廉价、耐用的配置文件存储:Grafana Phlare使用对象存储进行长期数据存储,使其能够利用这种普遍存在的、具有成本效益的、高耐用性的技术。它兼容多种对象存储实现,包括AWS S3、谷歌云存储、Azure Blob存储、OpenStack Swift,以及任何与S3兼容的对象存储。
- 原生多租户:Grafana Phlare的多租户架构使你能够隔离独立团队或业务部门的数据和查询,从而使这些组可以共享一个数据库
架构
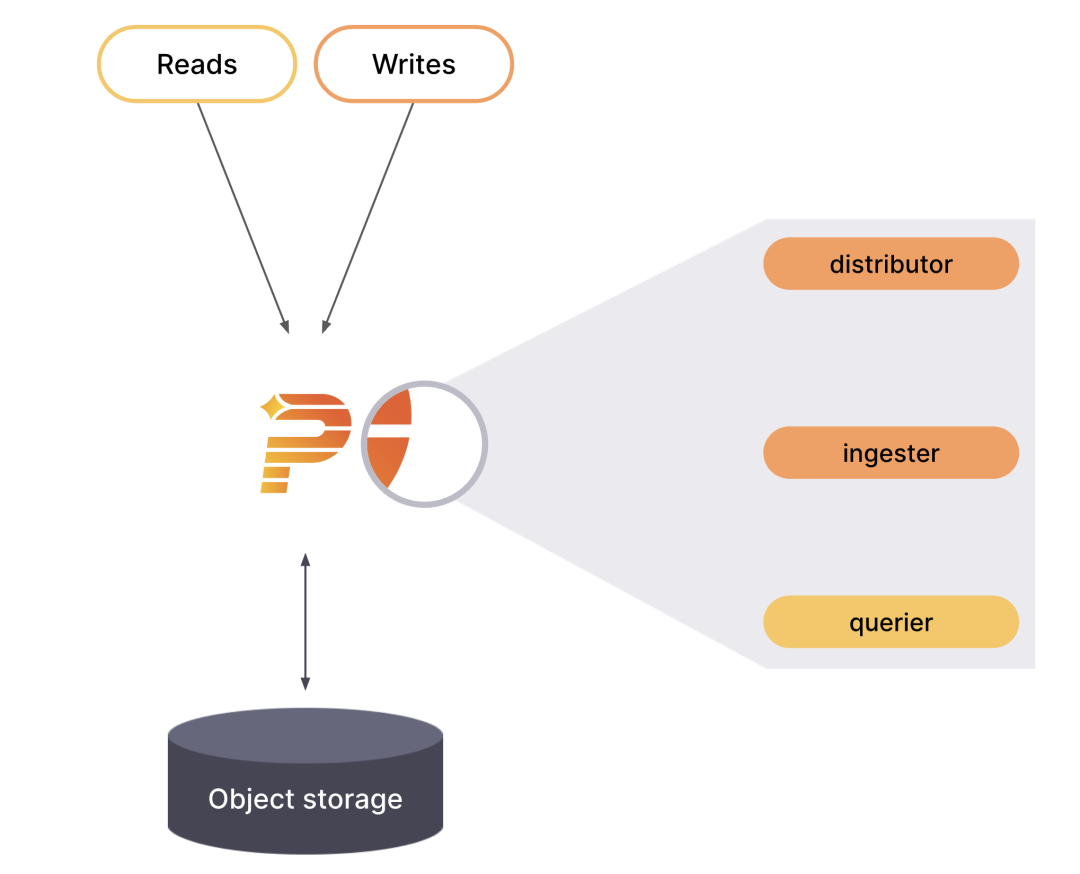
Grafana Phlare具有基于微服务的架构。该系统具有多个可水平扩展的微服务,可以单独和并行运行。Grafana Phlare微服务称为组件。
Grafana Phlare的设计将所有组件的代码编译为单个二进制文件。该-target参数控制单个二进制文件将作为哪些组件运行。想快速体验的话,Grafana Phlare也可以在单体模式下运行,所有的组件在一个进程中同时运行。
Grafana Phlare大多数组件是无状态的,不需要在进程重启之间保留任何数据。一些组件是有状态的,并依靠不容易丢失的存储来防止进程重启之间的数据丢失。
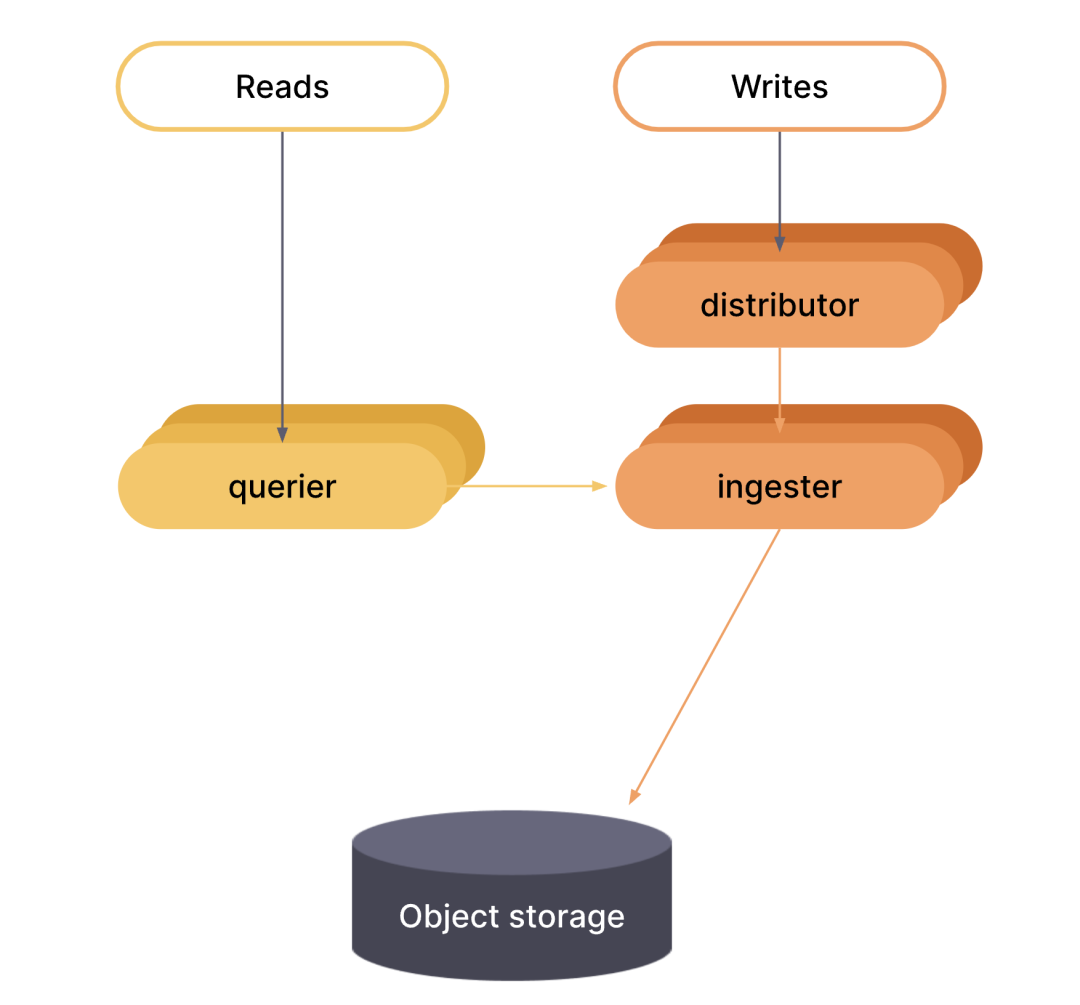
Grafana Phlare包含了一组交互以形成集群的组件:Distributor、Ingester、Querier。
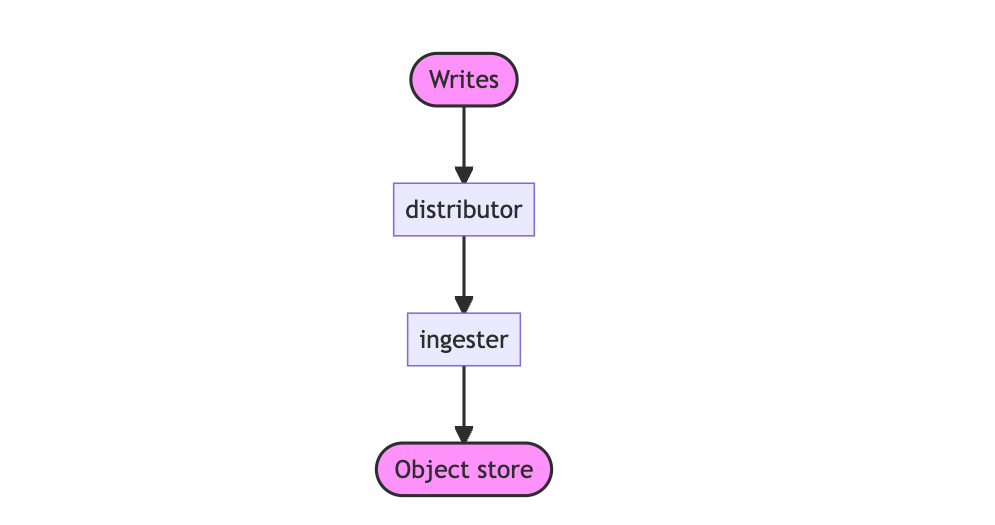
写入路径
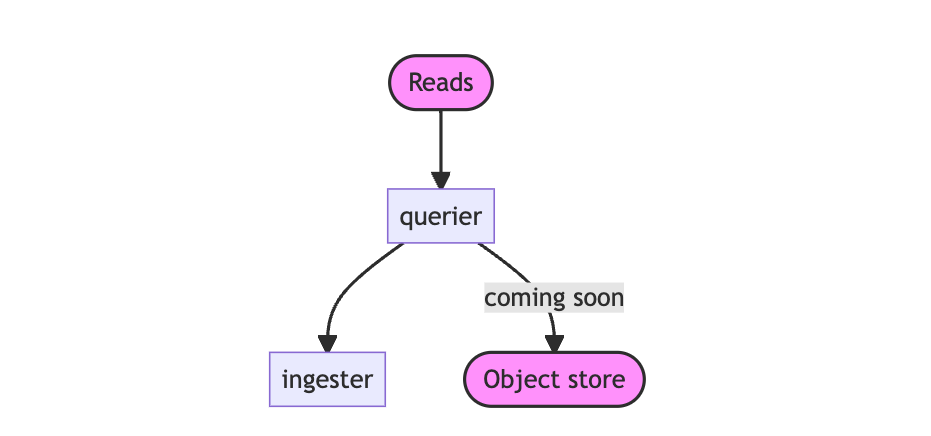
 读取路径
读取路径
组件
-
distributor: distributor是一个无状态组件,它从代理那里接受分析数据。然后distributor将数据分成批次并发送给多个ingesters,在ingesters之间对系列进行分片,并通过配置的复制因子复制每个系列。默认情况下,配置的复制因子为3。
-
ingester:ingester是一个有状态的组件,它首先将传入的配置文件写入写入路径上的磁盘存储中,并返回系列样本以用于读取路径上的查询。
来自distributor的传入配置文件不会立即写入长期存储,而是保存在ingester内存中或卸载到ingester磁盘。最终,所有配置文件都写入磁盘并定期上传到长期存储。由于这个原因,queriers在读取路径上执行查询时,可能需要同时从queriers和长期存储中获取样本。
-
querier:querier是一个无状态组件,它通过获取读取路径上的配置文件系列和标签来评估查询表达式。
querier仅使用ingester组件查询最近写入的数据。下个版本计划支持查询长期存储。
部署模式
可以采用以下两种模式之一部署Grafana Phlare:
部署模式由-target参数决定,可以通过CLI标志或YAML配置来设置。
单体模式
单体模式是在单个进程中运行所有必需的组件,是默认的操作模式,你可以通过指定-target=all参数来设置,单体模式是部署Grafana Phlare最简单的办法。如果你想快速入门或想在开发环境中使用 Grafana Phlare,这将非常有用。要查看在 -target 设置为 all 时运行的组件列表,请使用 -modules 标志运行 Grafana Phlare
微服务模式
在微服务模式下,组件部署在不同的进程中。扩展是按组件进行的,这允许在扩展和更细化的故障域方面具有更大的灵活性。微服务模式是生产部署的首选方法,但也是最复杂的。
在微服务模式下,调用每个Grafana Phlare进程,并将其-target参数设置为特定的Grafana Phlare组件(例如,-target=ingester或-target=distributor)。要获得一个正常工作的Grafana Phlare实例,你必须部署每个必需的组件。如果你想使用微服务模式部署Grafana Phlare,那么非常建议使用kubernetes。
部署
二进制单体部署
参考官方文档,也可以使用docker直接部署
-
下载配置Phlare
1
2
3
|
#直接在Release下找到对应系统的二进制文件下载
wget https://github.com/grafana/phlare/releases/download/v0.1.0/phlare_0.1.0_linux_amd64.tar.gz
tar -zxvf phlare_0.1.0_linux_amd64.tar.gz
|
-
启动Phlare
要将Grafana Phlare作为单体运行并使用本地文件系统存储,你可以创建自己的配置文件,或者使用演示配置文件。
 1
 2
 3
 4
 5
 6
 7
 8
 9
10
11
12
13
14
|
##创建自己的配置文件
vim demo.yaml
# Do not use this configuration in production.
# It is for demonstration purposes only.
scrape_configs:
- job_name: "default"
scrape_interval: "15s"
static_configs:
- targets: ["127.0.0.1:4100"]
########使用演示配置文件#########
curl -fLo demo.yaml https://raw.githubusercontent.com/grafana/phlare/main/cmd/phlare/phlare.yaml
|
-
运行phalre
1
|
./phlare --config.file=./demo.yaml
|
-
确认Phlare已准备就绪。Grafana Phlare监听端口4100
1
|
curl localhost:4100/ready
|
-
配置数据源
这里使用docker部署Grafana
1
2
|
#注意:一定加上-e "GF_FEATURE_TOGGLES_ENABLE=flameGraph",默认安装的话 添加数据源的时候是找不到Phlare的
docker run -itd --name=grafana -p 3000:3000 -e "GF_FEATURE_TOGGLES_ENABLE=flameGraph"  grafana/grafana:main
|
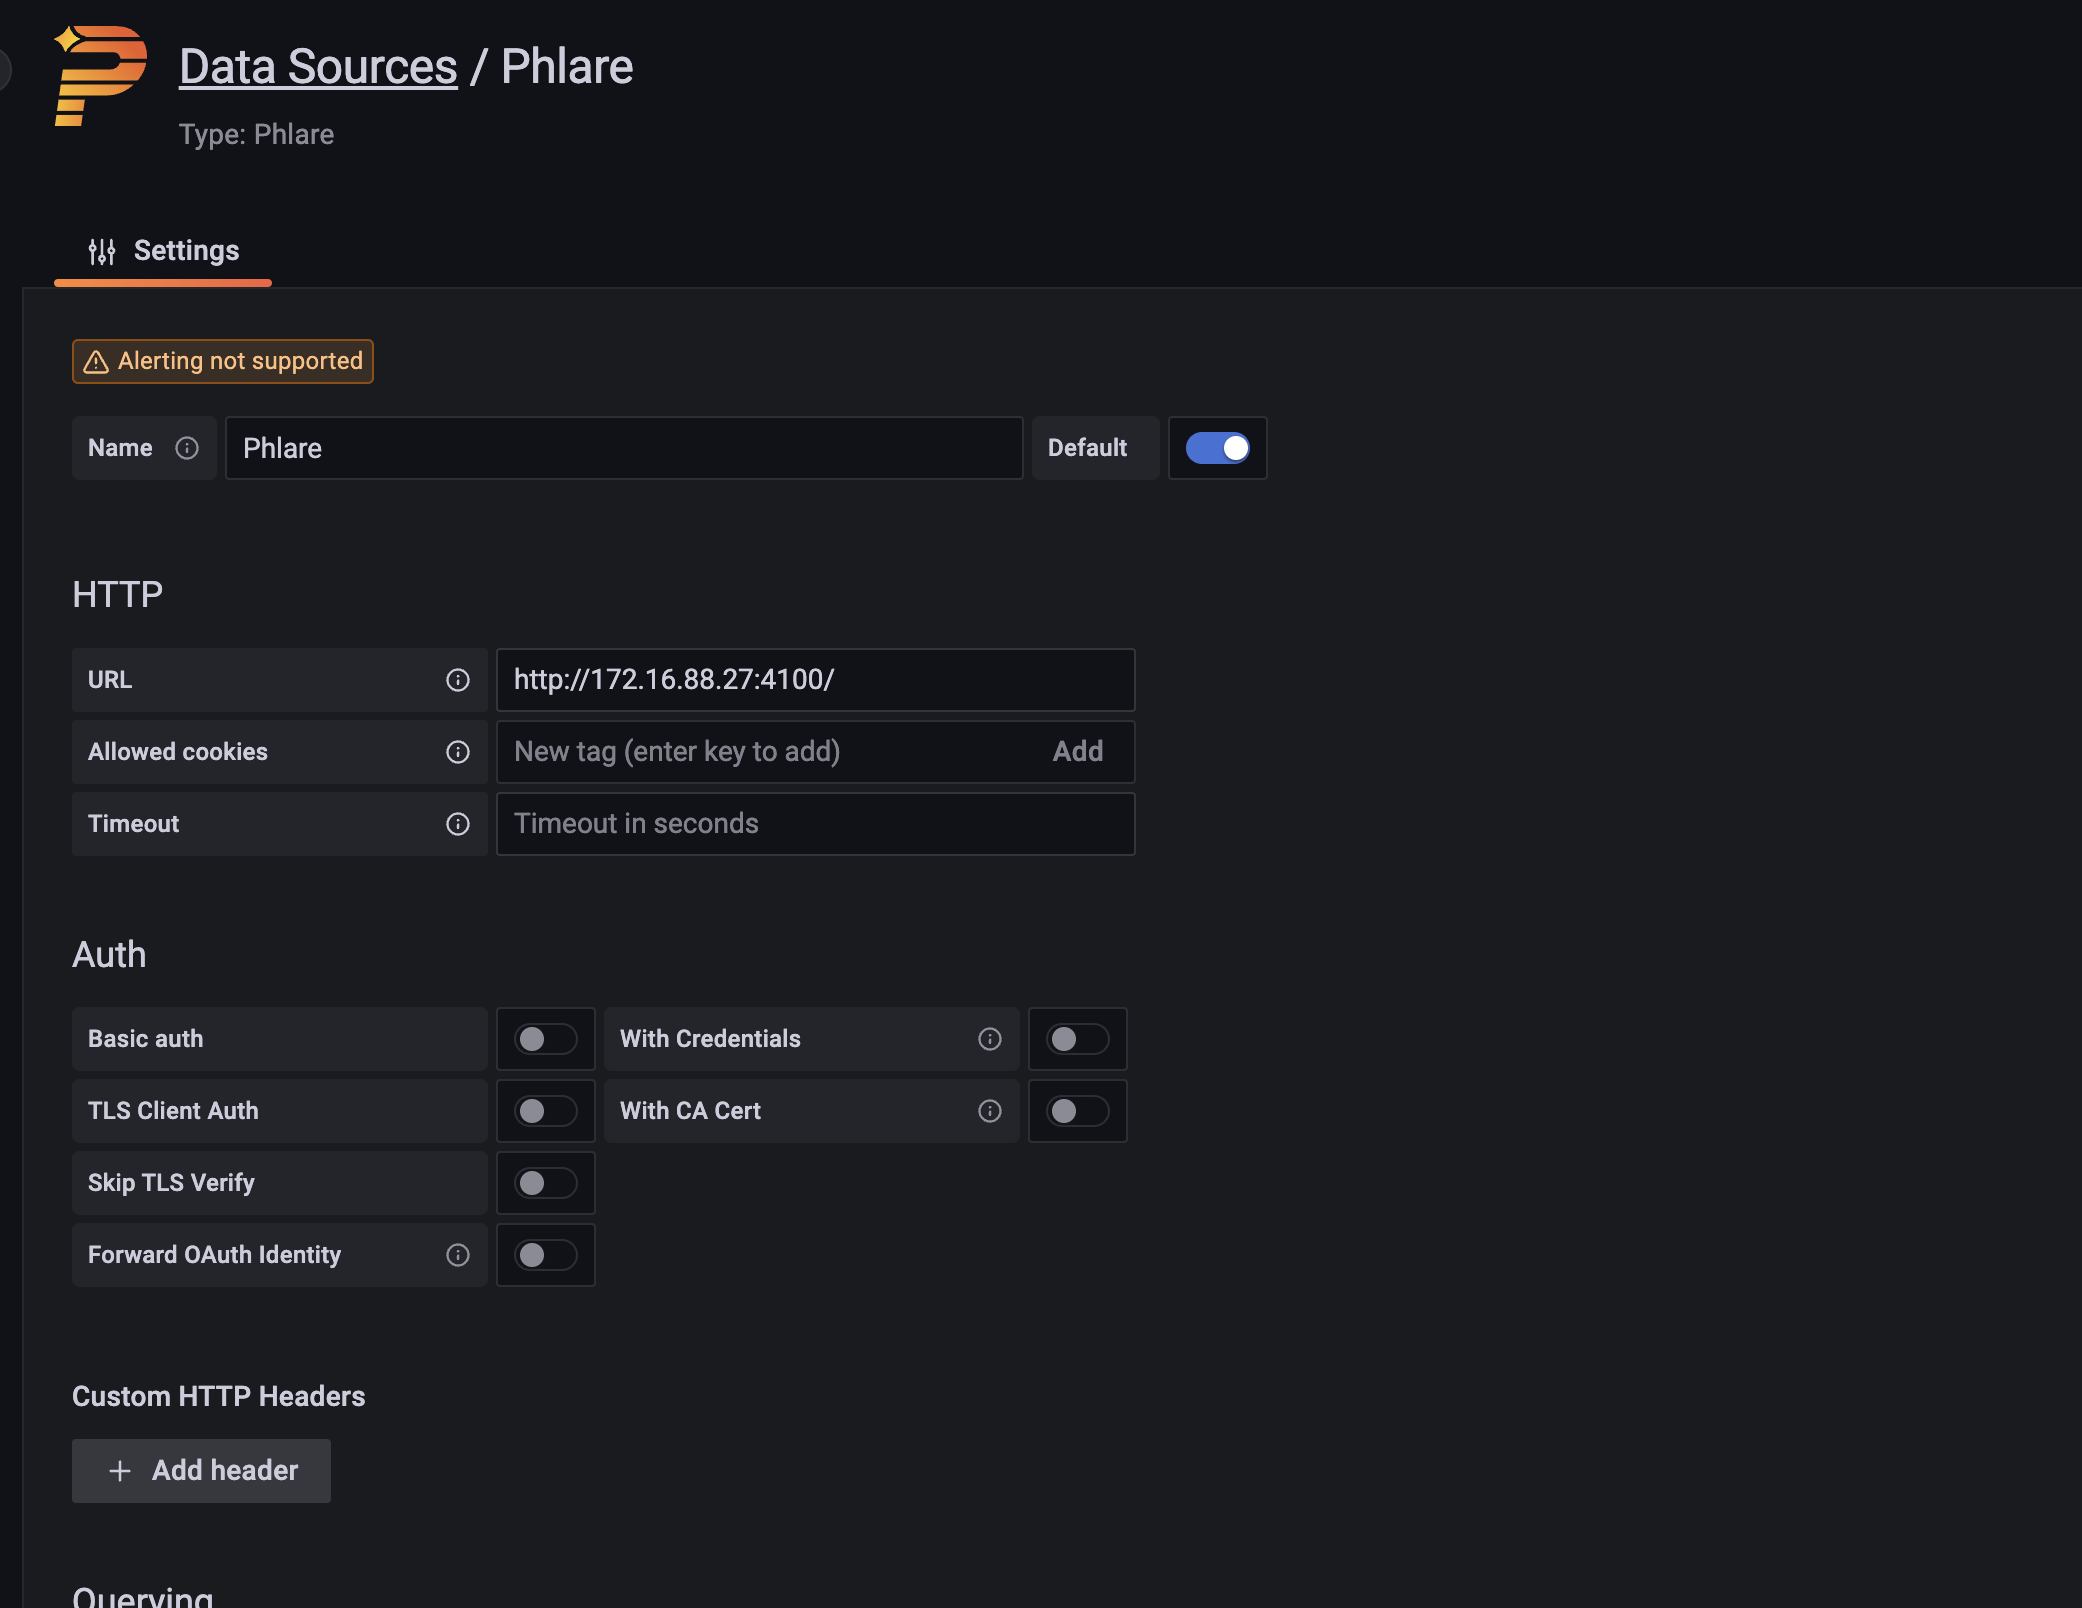
浏览器打开http://ip:3000即可访问Grafana服务了。点击设置->数据源来添加Profiling数据源,选择Phlare类型的数据源

设置数据源的URL
后续设置参考下面的kubernetes上部署的使用
在kubernetes部署(重点)
开始前说明
硬件要求:
- 具有至少4个内核和16GIB RAM的单个kubernetes节点
软件要求:
- kubernetes 1.20或更高版本
- 适用于你的Kubernetes版本的kubectl命令
- Helm 3或者更高
验证你是否拥有:
- 对Kubernetes集群的访问权
- 在Kubernetes集群中启用了持久化存储,该集群设置了一个默认的存储类。你可以改变默认的StorageClass。
- DNS服务在Kubernetes集群中工作
在自定义命名空间安装
首先创建一个名为phlare-test的命令空间,将整个应用都部署在该命名空间中:
1
|
kubectl create namespace phlare-test
|
添加对应的helm存储库
1
2
3
4
|
helm repo add grafana https://grafana.github.io/helm-charts
helm repo update
#注意:https ://grafana.github.io/helm-charts上的 Helm 图表是grafana/phlare源代码的发布。
|
使用helm可以选择以下两种选项安装Grafana Phlare:
选项一 单体模式,只需要需要执行下面的命令即可一键安装:
1
|
helm -n phlare-test install phlare grafana/phlare
|
选项二 微服务模式,这里选择此方式。首先获取官方提供的默认 values 配置文件:
 1
 2
 3
 4
 5
 6
 7
 8
 9
10
11
12
13
14
15
16
17
18
19
20
21
22
23
24
25
26
27
28
29
30
31
32
33
34
35
36
37
38
39
40
41
42
43
44
45
46
47
48
49
50
51
|
# Gather the default config for micro-services
curl -Lo values-micro-services.yaml https://raw.githubusercontent.com/grafana/phlare/main/operations/phlare/helm/phlare/values-micro-services.yaml
cat values-micro-services.yaml
# Default values for phlare.
# This is a YAML-formatted file.
# Declare variables to be passed into your templates.
phlare:
components:
querier:
kind: Deployment
replicaCount: 3
resources:
limits:
memory: 1Gi
requests:
memory: 256Mi
cpu: 100m
distributor:
kind: Deployment
replicaCount: 2
resources:
limits:
memory: 1Gi
requests:
memory: 256Mi
cpu: 500m
agent:
kind: Deployment
replicaCount: 1
resources:
limits:
memory: 512Mi
requests:
memory: 128Mi
cpu: 50m
ingester:
kind: StatefulSet
replicaCount: 3
resources:
limits:
memory: 12Gi
requests:
memory: 6Gi
cpu: 1
minio:
enabled: true
|
使用上面的values文件来安装Grafana Phlare,资源不多的话 可以根据实际情况修改一下配置。然后使用以下命令安装
 1
 2
 3
 4
 5
 6
 7
 8
 9
10
11
12
13
14
15
16
17
18
19
20
|
helm -n phlare-test upgrade --install phlare grafana/phlare -f values-micro-services.yaml
Release "phlare" does not exist. Installing it now.
NAME: phlare
LAST DEPLOYED: Thu Nov 10 14:47:00 2022
NAMESPACE: phlare-test
STATUS: deployed
REVISION: 1
TEST SUITE: None
NOTES:
Thanks for deploying Grafana Phlare.
In order to configure Grafana to use the Phlare datasource, you need to add the Phlare datasource to your Grafana instance.
The in-cluster query URL is:
http://phlare-querier.phlare-test.svc.cluster.local.:4100
To forward the query API to your localhost you can use:
kubectl --namespace phlare-test port-forward svc/phlare-querier 4100:4100
|
部署完成后查看相关服务状态是否正常:
 1
 2
 3
 4
 5
 6
 7
 8
 9
10
11
12
13
|
kubectl get pods -n phlare-test
NAME READY STATUS RESTARTS AGE
phlare-agent-56986dd4b9-rrb88 1/1 Running 0 3m39s
phlare-distributor-7447b4c6c5-9lcwg 1/1 Running 0 3m39s
phlare-distributor-7447b4c6c5-fbfms 1/1 Running 0 3m39s
phlare-ingester-0 1/1 Running 0 3m39s
phlare-ingester-1 1/1 Running 0 3m39s
phlare-ingester-2 1/1 Running 0 3m39s
phlare-minio-0 1/1 Running 0 3m39s
phlare-querier-8cdf986c-ftgb5 1/1 Running 0 3m39s
phlare-querier-8cdf986c-g9nxk 1/1 Running 0 3m39s
phlare-querier-8cdf986c-mw7fh 1/1 Running 0 3m39s
|
等到所有 pod 的状态为Running或Completed,就部署完成了,这可能需要几分钟。
使用
在Grafana中配置
在安装 Phlare 的同一个 Kubernetes 集群中安装 Grafana
 1
 2
 3
 4
 5
 6
 7
 8
 9
10
11
|
helm upgrade -n phlare-test --install grafana grafana/grafana \
  --set image.repository=aocenas/grafana \
  --set image.tag=profiling-ds-2 \
  --set env.GF_FEATURE_TOGGLES_ENABLE=flameGraph \
  --set env.GF_AUTH_ANONYMOUS_ENABLED=true \
  --set env.GF_AUTH_ANONYMOUS_ORG_ROLE=Admin \
  --set env.GF_DIAGNOSTICS_PROFILING_ENABLED=true \
  --set env.GF_DIAGNOSTICS_PROFILING_ADDR=0.0.0.0 \
  --set env.GF_DIAGNOSTICS_PROFILING_PORT=6060 \
  --set-string 'podAnnotations.phlare.grafana.com/scrape=true' \
  --set-string 'podAnnotations.phlare.grafana.com/port=6060'
|
输出如下:
 1
 2
 3
 4
 5
 6
 7
 8
 9
10
11
12
13
14
15
16
17
18
19
20
21
22
23
24
25
26
27
|
Release "grafana" does not exist. Installing it now.
W1110 15:03:12.989605 31904 warnings.go:67] policy/v1beta1 PodSecurityPolicy is deprecated in v1.21+, unavailable in v1.25+
W1110 15:03:13.035318 31904 warnings.go:67] policy/v1beta1 PodSecurityPolicy is deprecated in v1.21+, unavailable in v1.25+
NAME: grafana
LAST DEPLOYED: Thu Nov 10 15:03:12 2022
NAMESPACE: phlare-test
STATUS: deployed
REVISION: 1
NOTES:
1. Get your 'admin' user password by running:
kubectl get secret --namespace phlare-test grafana -o jsonpath="{.data.admin-password}" | base64 --decode ; echo
2. The Grafana server can be accessed via port 80 on the following DNS name from within your cluster:
grafana.phlare-test.svc.cluster.local
Get the Grafana URL to visit by running these commands in the same shell:
export POD_NAME=$(kubectl get pods --namespace phlare-test -l "app.kubernetes.io/name=grafana,app.kubernetes.io/instance=grafana" -o jsonpath="{.items[0].metadata.name}")
kubectl --namespace phlare-test port-forward $POD_NAME 3000
3. Login with the password from step 1 and the username: admin
#################################################################################
###### WARNING: Persistence is disabled!!! You will lose your data when #####
###### the Grafana pod is terminated. #####
#################################################################################
|
查看状态:
1
2
|
kubectl get pods -n phlare-test  |grep grafana
grafana-76cb8b56f-k6fwm               1/1     Running   0          112s
|
访问Grafana。可以使用以下命令在本地转发Grafana服务:
1
|
kubectl port-forward -n phlare-test service/grafana 3000:80
|
我这里测试,直接将Grafana的svc修改为了NodePort
1
2
|
kubectl get svc -n phlare-test |grep grafana
grafana                    NodePort    10.68.113.17    <none>        80:30080/TCP   6m40s
|
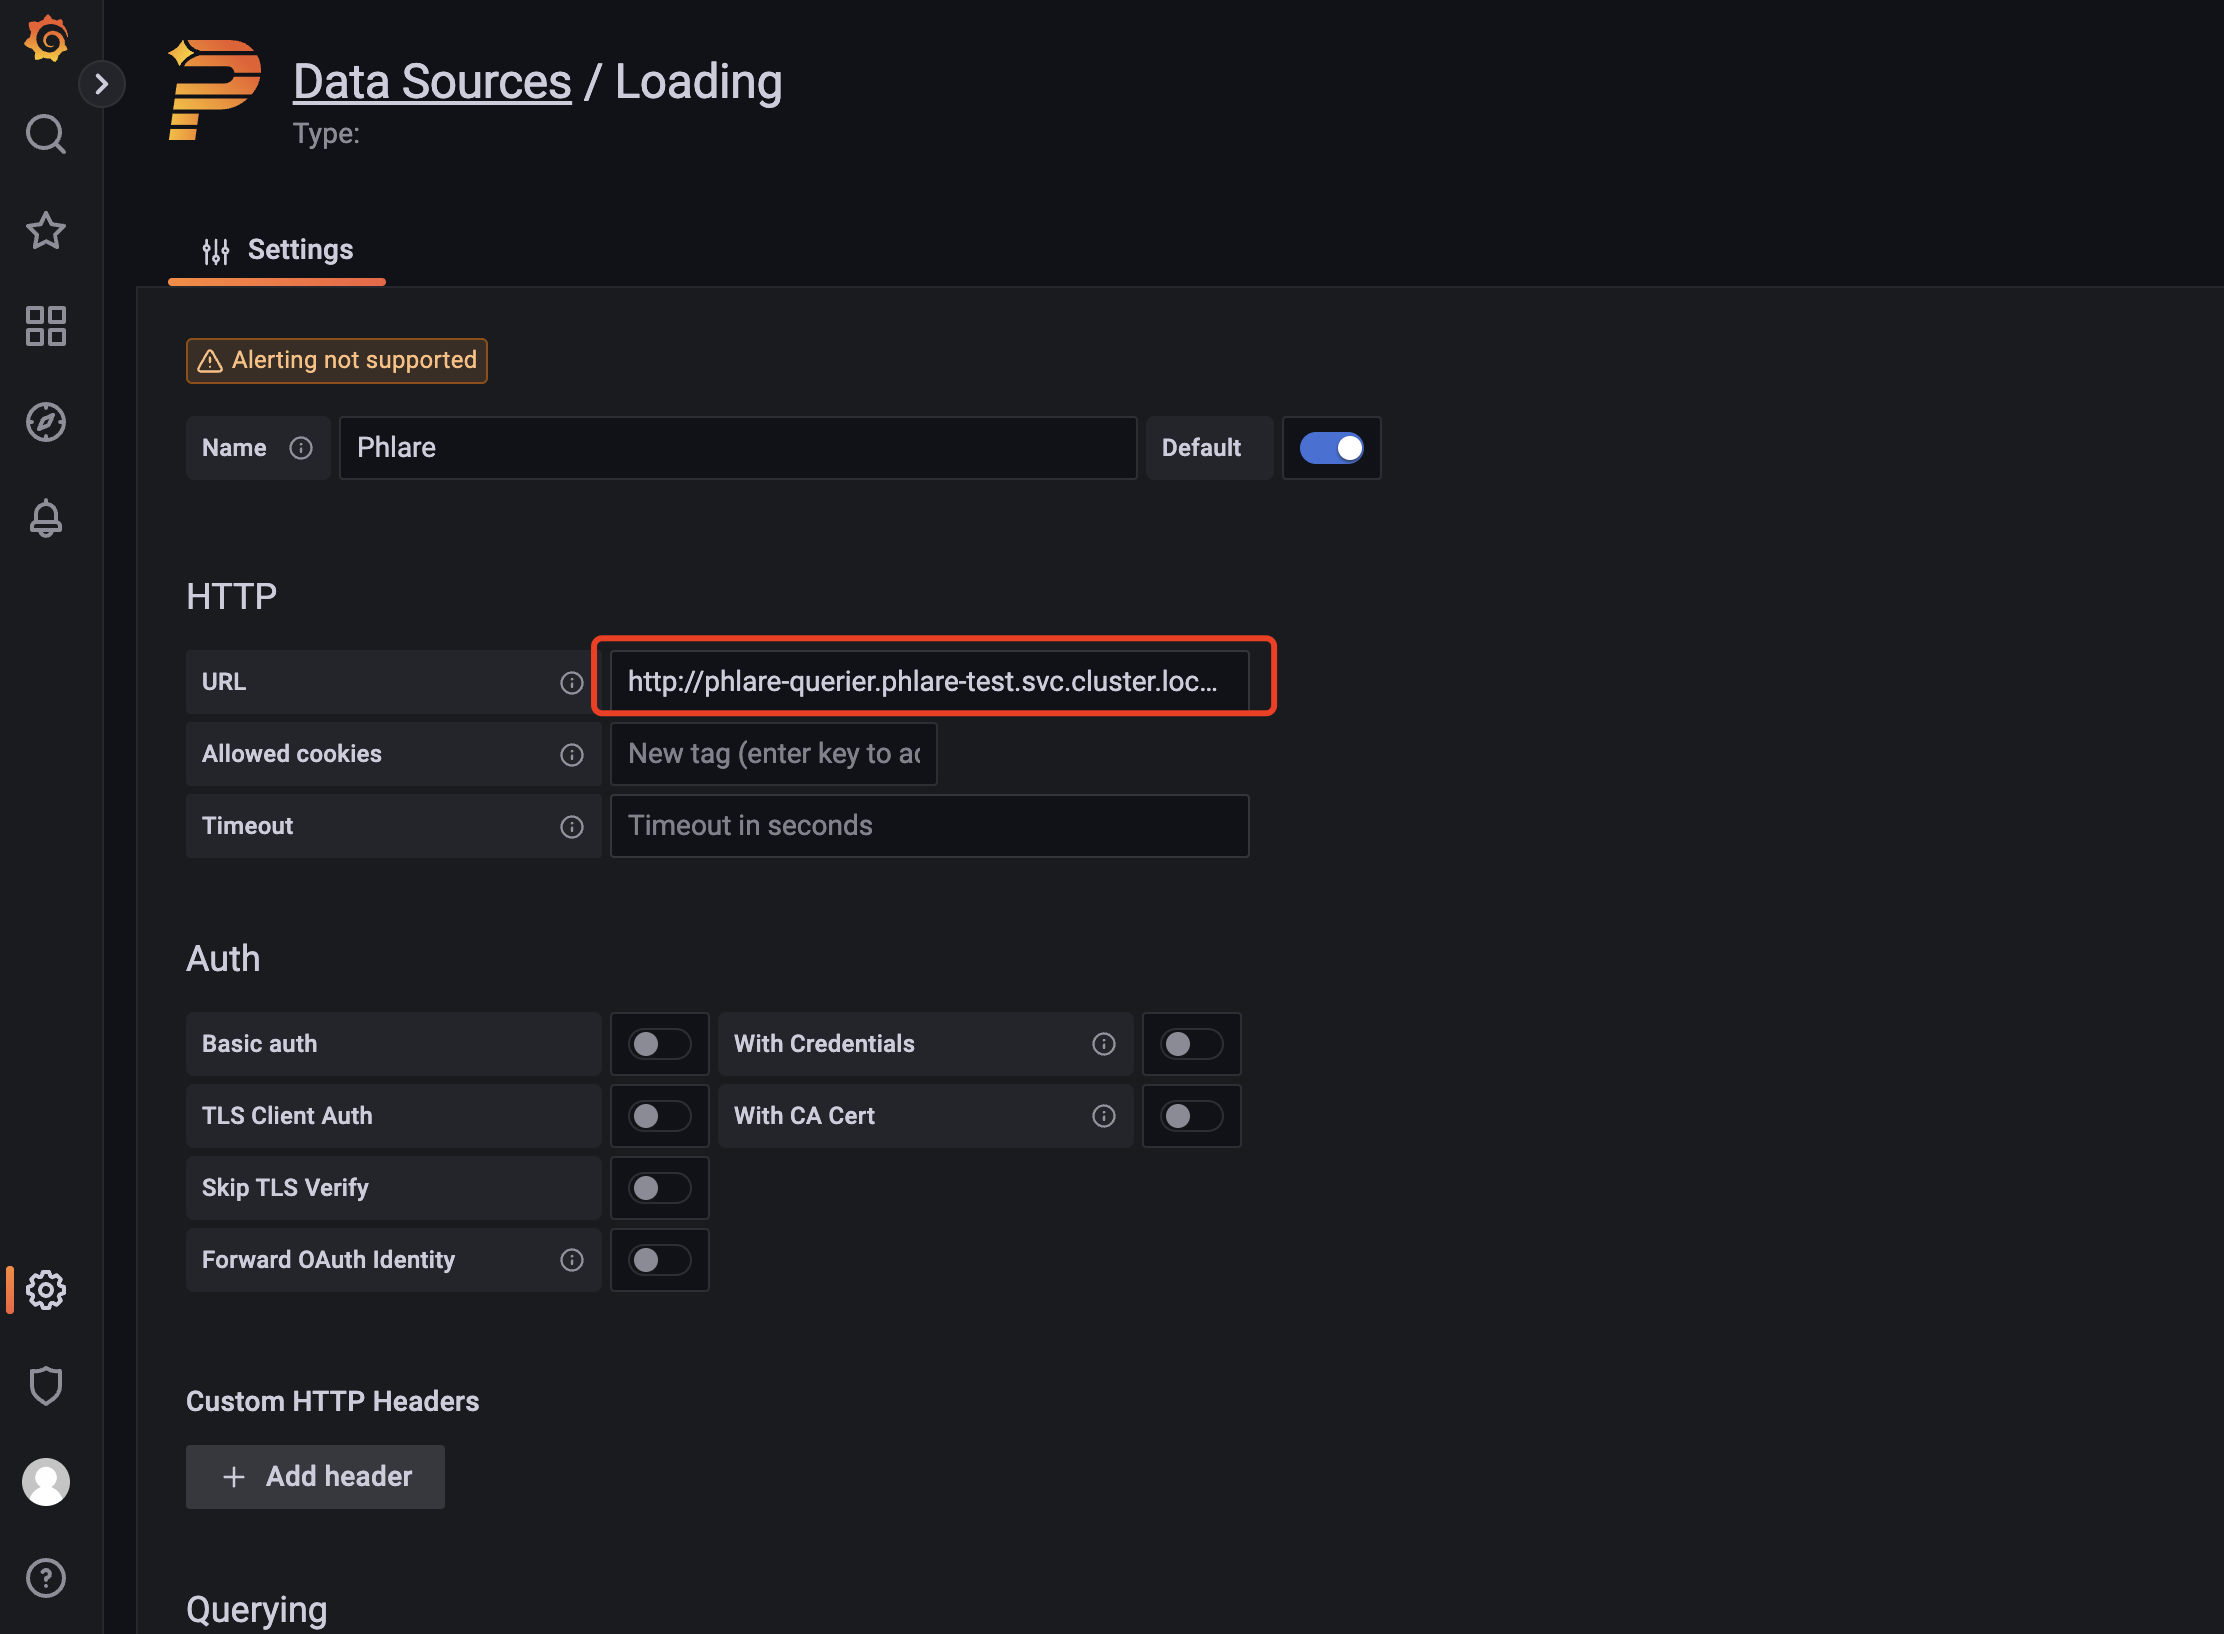
浏览器打开http://ip:30080即可访问Grafana服务了。点击设置->数据源来添加Profiling数据源,选择Phlare类型的数据源
设置数据源的 URL 为 http://phlare-querier.phlare-test.svc.cluster.local.:4100/
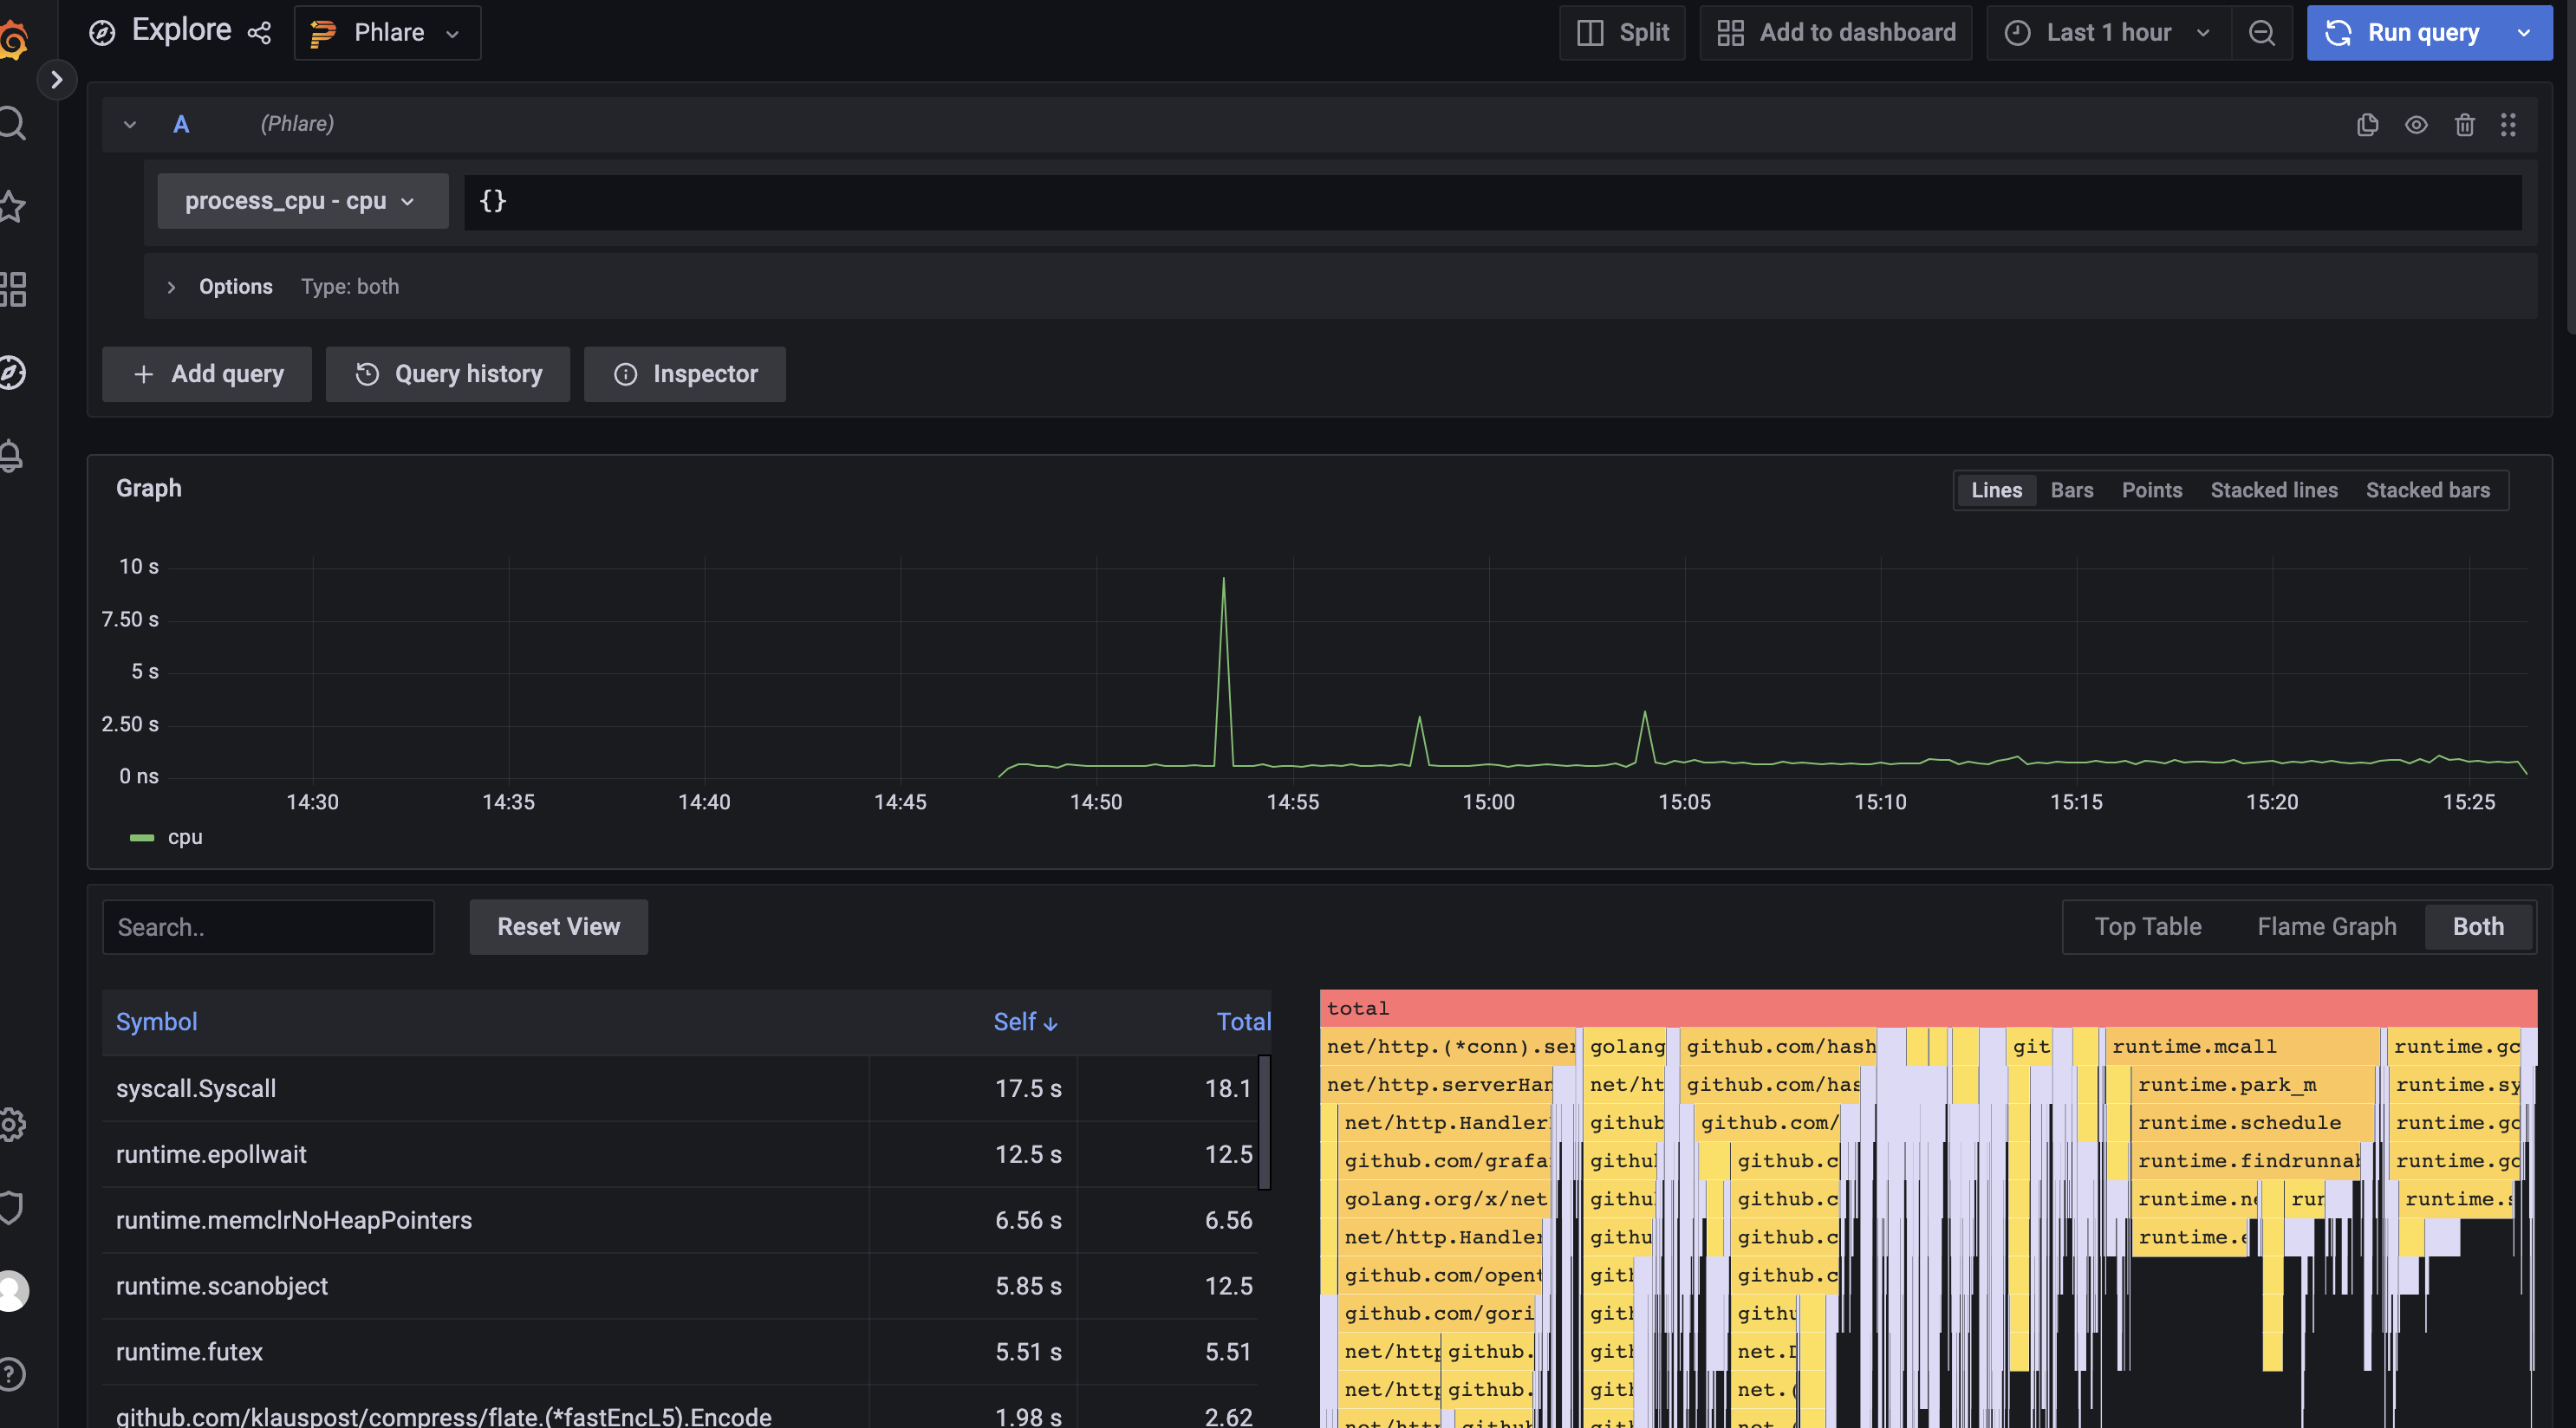
保存成功后,你应该就能够在Grafana Explore中查询配置条件,以及使用新配置的Phlare数据源创建仪表盘面板了。
使用方法和loki及Prometheus基本一样,如下图查询cpu的情况
Phlare的helm chart使用默认配置,只要它们有正确的注释,它的代理就会抓取pod。此功能使用可能于Prometheus或Grafana Agent配置类似的relabel_config和kubernetes_sd_config。
为了让Phlare抓取pod,你必须在pods中添加以下注释:
1
2
3
4
|
metadata:
  annotations:
    phlare.grafana.com/scrape: "true"
    phlare.grafana.com/port: "8080"
|
phlare.grafana.com/port应该设置为你的pod为/debug/pprof/端点提供服务的端口。请注意,phlare.grafana.io/scrape 和 phlare.grafana.io/port的值必须用双引号括起来,以确保它表示为字符串。
上面我们安装Grafana的时候配置了这两个注解,我们也就可以使用Phlare来抓取Grafana应用的profiles数据。
扩展
在Grafana上持久添加数据源
Grafana的部署没有持久化数据库,所以它不会在重启时保留数据源配置等设置。
为了确保在启动是配置数据源,请创建以下的datasources.yaml文件:
1
2
3
4
5
6
7
8
|
datasources:
  phlare.yaml:
   apiVersion: 1
   datasources:
   - name: Phlare
     type: phlare
     uid: phlare-test
     url: http://phlare-querier.phlare-test.svc.cluster.local.:4100/
|
通过运行以下命令修改Helm部署
1
2
|
helm upgrade -n phlare-test --reuse-values grafana grafana/grafana \
--values datasources.yaml
|
参考链接
官方文档
k8s技术圈
 支付宝
支付宝
 微信
微信